October 2026 Market Update
October 2026 Market Update
"Booms and busts aren’t proof that innovation failed but they show how capital overfunds the future before the economy absorbs it productively. The hype cycle often destroys weak balance sheets, but it rarely destroys genuine platform technology." – Wealthspire Advisors
The Quarter in Review –
- The conflict in the Middle East intensified during the quarter, driving crude oil prices above $100 per barrel in mid-September and pushing diesel prices above $6 per gallon.
- Citing persistent inflationary pressures, the Federal Reserve raised short-term interest rates for the first time since 2023.
- Despite higher energy prices, tighter monetary policy, and geopolitical uncertainty, the U.S. economy continued to expand at a healthy pace.
- Equity markets remained resilient as strong corporate earnings, broadening market participation, and continued investment in AI infrastructure helped keep major indices near record highs.
- The 10-year Treasury yield moved above 5% by the end of September, reflecting higher inflation expectations and increased term premiums.
- Looking ahead, November's midterm elections represent an additional source of uncertainty for markets and policymakers.
U.S. Economy Remains Resilient Despite Headwinds
The U.S. economy continued to expand during the third quarter despite several challenges, including higher oil prices, a prolonged conflict with Iran, rising global bond yields, persistent inflation, and the Federal Reserve's decision to resume raising interest rates. Economic growth was supported by strong corporate earnings, resilient consumer demand, and ongoing productivity gains driven by technological innovation and AI-related investment.
Second-quarter GDP grew at an annualized rate of 2.2%. Consumer spending and business investment were the primary drivers of growth. Consumption contributed 2.5 percentage points to GDP growth during the quarter, exceeding its average contribution since 2000 (see table below). Business investment also contributed more than its long-term average, reflecting continued confidence among corporate decisionmakers.
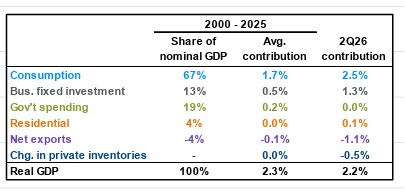
Source: Bureau of Economic Analysis, JP Morgan
Each month, purchasing managers in both the manufacturing and services sectors are surveyed regarding business activity, including new orders, employment, and pricing trends. A composite measure derived from these surveys has historically exhibited a strong relationship with real GDP growth and currently suggests economic activity accelerated during the third quarter.
The same inflation composite points to renewed inflationary pressures. Much of this reflects higher energy prices as the conflict with Iran continued to constrain supply during the quarter. The Personal Consumption Expenditures (PCE) Deflator increased 3.4% year over year in August, while the Core PCE Deflator, which excludes the more volatile food and energy categories, rose 3.0%. Both measures remain above the Federal Reserve's 2% inflation target.
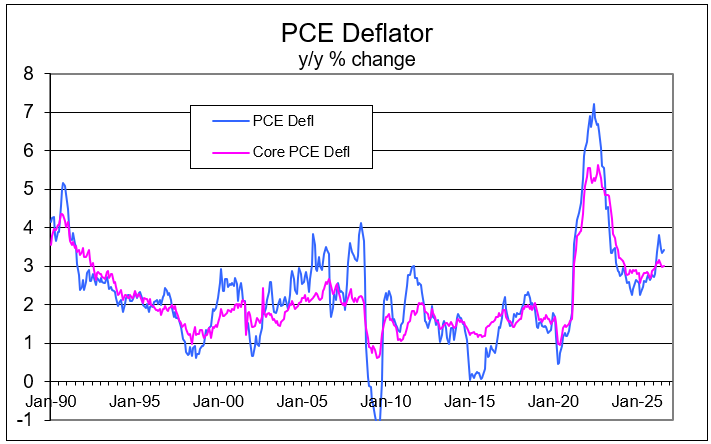
Source: RubinBrown Advisors, Bureau of Economic Analysis, as of August 2026
Federal Reserve Resumes Tightening
On September 16, the Federal Open Market Committee (FOMC) raised the federal funds rate by 25 basis points to a target range of 3.75%-4.00%, marking the first rate hike since 2023.
In its policy statement, the Committee noted:
"Economic activity is expanding at a solid pace. While uncertainty remains elevated owing, in part, to geopolitical developments, domestic spending has been resilient. Productivity growth is strong, and capital investment is robust. Job gains have kept pace with the workforce, and the unemployment rate has changed little.
Inflation remains elevated. Today's policy action will support a timelier return to the Committee's 2 percent goal. The Committee will deliver price stability."
The Federal Reserve's dual mandate remains maximum employment and price stability. While the labor market remains tight, it has clearly moderated. Employers added an average of just 50,000 jobs per month during the three months ending in September, down from more than 100,000 per month in 2024. Despite slower job growth, the unemployment rate has remained near 4%, supported by constrained labor supply resulting from an aging population and relatively low immigration.
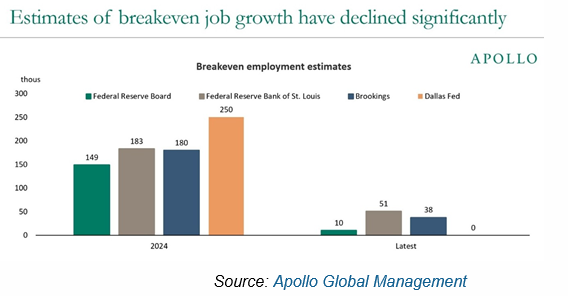
The chart below highlights how dramatically expectations among economic observers have shifted over the past two years regarding the number of jobs required to maintain a stable unemployment rate. Estimates from the Federal Reserve, the Federal Reserve Banks of St. Louis and Dallas, and the Brookings Institution show that the average breakeven pace of job growth has fallen from roughly 190,000 jobs per month two years ago to just 25,000 today.
As a result, September's payroll gain of 29,000 jobs, which historically would have been considered disappointing, is now broadly consistent with maintaining a stable unemployment rate. Indeed, that is exactly what occurred.
Lessons from Past Federal Reserve Tightening Cycles
Charles Schwab recently examined prior Federal Reserve tightening cycles and evaluated how equity markets responded to rising short-term interest rates. Their research highlights several key observations:
- Federal Reserve tightening cycles have historically produced near-term market volatility, although equities have generally recovered following the initial period of weakness.
- The pace of tightening matters. Slower hiking cycles have historically been associated with milder equity market declines and stronger economic outcomes than rapid tightening cycles.
- A resilient labor market and healthy economic fundamentals support a more gradual policy approach, with periods of volatility potentially creating opportunities for disciplined investors.
Here is a link to the Schwab article for more detail and graphics.
https://www.schwab.com/learn/story/take-hike-rate-hikes-and-market-impacts
Long Term Bonds Moved Higher
The 10-year Treasury yield finished the quarter at 5.29%, an increase of 82 basis points from the end of the second quarter.
While rising yields can create near-term pressure on bond prices, starting yields have historically been one of the strongest indicators of future long-term bond returns. Higher yields increase expected future returns and provide a larger income cushion against future volatility.
As Jeff Sommer of The New York Times recently noted:
"Higher interest rates now suggest that future bond returns will be higher, too. The richer yields will buffer price losses that inevitably occur when market interest rates rise. Don't let the bond market headlines scare you too much. The bond market's troubles are opening opportunities for patient investors."
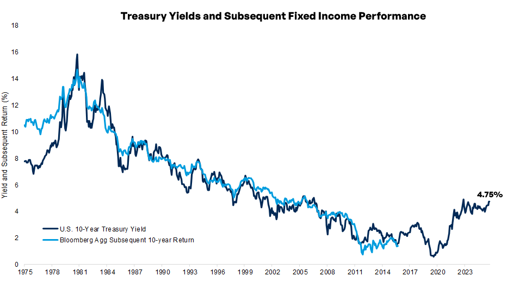
Source: FactSet, Morningstar Direct, Fiducient Advisors (as of 8/31/2026)
Between 2022 and 2023, most of the increase in the 10-year Treasury yield reflected markets repricing expectations for future Federal Reserve policy. More recently, however, term premium has become a larger driver. As of July 2026, term premium accounted for approximately half of the increase in yields, reflecting investors' demand for greater compensation to hold long-term government debt amid elevated Treasury issuance, buyback announcements, and less predictable monetary policy guidance.
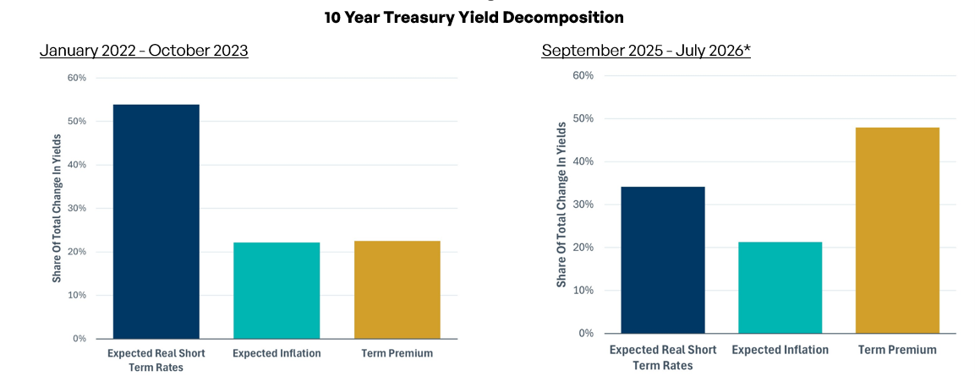
Source: Payden & Rygel, "Chart of the Week: Blame Game — Decomposing The Change In The 10-Year Treasury Yield," week ending 9/4/2026. Underlying data: Federal Reserve; D'Amico, Kim & Wei (2018); Payden calculations. Term premium is a model estimate combining yield curve data with survey forecasts, updated monthly through July 2026
What’s Next for the AI Capex Cycle?
The AI investment boom has been one of the most important drivers of equity market performance over the past two years and continues to show little sign of slowing. According to Oxford Economics, cumulative AI-related investment has exceeded 2% of U.S. GDP over the last three years, while the IMF estimates that AI-related technology investment contributed approximately 0.5 percentage points to U.S. GDP growth during 2025.
The impact on corporate earnings has been even more significant. The S&P 500 is expected to deliver a third consecutive quarter of year-over-year earnings growth exceeding 25%. Strong earnings growth has provided a critical source of support for equity markets despite tighter financial conditions and elevated geopolitical uncertainty. Importantly, much of the market's advance has been driven by earnings growth rather than a substantial expansion in valuation multiples.
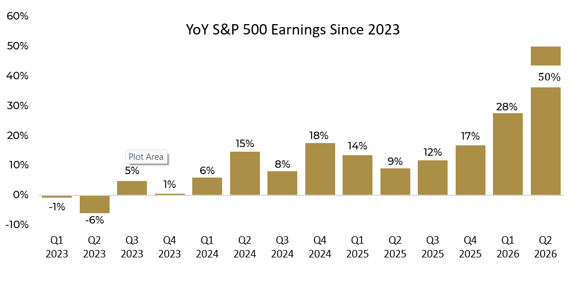
Source: FactSet. Data through Q2 2026.
The scale of today's AI investment cycle is historically significant, but the conversation is evolving. The focus is gradually shifting from the amount companies are spending on AI infrastructure to whether those investments will generate adequate returns and how they will ultimately be financed.
A year ago, most AI-related spending was funded through operating cash flow generated by some of the world's strongest businesses. While that remains partially true, there is growing evidence that these investments are beginning to impact financial flexibility and balance sheets across the technology ecosystem.
Consensus forecasts now project negative free cash flow for several major hyperscale technology companies due to extraordinary AI-related capital expenditures. As internal cash generation has become less sufficient, many firms have increasingly turned to debt markets to finance continued investment.
Credit market participants have already noticed this shift. Credit spreads for several large cloud and AI infrastructure companies have widened relative to other high-quality corporate borrowers. While financing costs remain manageable for investment-grade issuers, the Federal Reserve's renewed tightening cycle has increased market sensitivity to rising leverage, negative free cash flow, and uncertainty regarding future returns on rapidly depreciating technology assets.
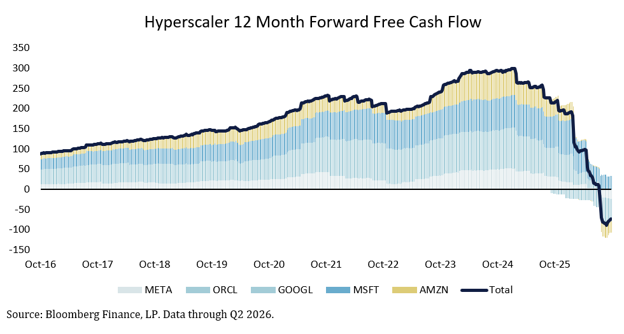
None of this points to an imminent slowdown in AI investment. However, it does reinforce the importance of understanding potential risks and maintaining balance within portfolios. Debt can bridge the gap between investment and future revenue generation, but it can also magnify risks if customer adoption or productivity gains fail to materialize as expected.
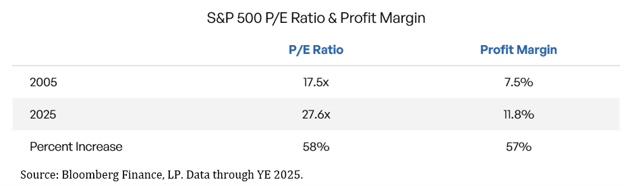
The broader market's increased participation in gains during 2026 is a positive sign of resilience, and current valuations do not appear obviously disconnected from fundamentals. Between 2005 and 2025, the trailing 12-month P/E ratio of the S&P 500 expanded approximately 58%, rising from 17.5x to 27.6x. While this may initially suggest significant valuation expansion, profit margins increased by a comparable amount during the same period. A reasonable argument can therefore be made that stronger fundamentals and enhanced earnings power justify higher valuations. Much of that improvement has been driven by technological innovation and the expanding AI ecosystem.
As the AI investment cycle evolves, investors must balance participation with discipline. The decision is not simply whether to embrace or avoid AI-related opportunities. Diversification remains essential, particularly because many seemingly distinct businesses, such as chip manufacturers, cloud providers, and data-center operators, ultimately depend on the same underlying investment cycle.
Valuation should remain the final filter. Even exceptional businesses can produce disappointing investment outcomes when expectations become too optimistic. Investors should continually evaluate the assumptions embedded in current prices regarding growth, margins, adoption rates, and capital intensity. The AI opportunity can continue to develop successfully even as economic conditions become less forgiving, but maintaining exposure without abandoning discipline will remain critical.
International Equities Continue to Look Attractive
International equities have significantly outperformed U.S. stocks thus far in 2026, and we believe that trend could continue into 2027.
One reason is valuation. Even after their recent rally, international equities continue to trade at a meaningful discount relative to U.S. stocks. Additionally, as interest-rate differentials narrow, a softer U.S. dollar could provide an additional tailwind for international returns from the perspective of U.S.-based investors.
Fundamentals are also improving across several key regions. In emerging markets, the AI investment cycle is creating opportunities throughout global supply chains. In Japan, ongoing corporate governance reforms continue to encourage greater efficiency, higher profitability, and stronger shareholder returns.
There are, however, risks. Just as market concentration has become a growing concern in the United States, similar dynamics are beginning to emerge abroad, particularly within emerging markets. As a result, diversification remains just as important internationally as it does domestically.
Overall, we remain constructive on international equities and believe they continue to offer an attractive combination of valuation support, improving fundamentals, and diversification benefits.
Outlook
The remainder of 2026 is likely to present several challenges for financial markets. The Federal Reserve has two scheduled meetings remaining this year, and market pricing continues to indicate the possibility of at least one additional rate increase.
The Fed faces a particularly difficult policy environment. The economy is being influenced by factors that fall partially outside the traditional scope of monetary policy. The ongoing AI infrastructure buildout continues to generate substantial capital spending and economic momentum that may prove relatively insensitive to modest increases in borrowing costs. At the same time, geopolitical tensions and higher energy prices are contributing to inflationary pressures that cannot be fully addressed through tighter monetary policy alone.
November's midterm elections also introduce uncertainty. While Republicans currently maintain narrow majorities in both the House and Senate, control of Congress remains highly contested. Historically, the president's party has tended to lose seats during midterm elections, and current prediction markets suggest this cycle may follow that pattern.
The good news for investors is that markets have historically performed well following midterm elections as political uncertainty diminishes. More importantly, the primary drivers of long-term market returns remain intact. Economic activity continues to expand, labor market conditions remain healthy, and corporate earnings continue to exceed expectations across many sectors.
Although volatility is likely to persist, we remain cautiously optimistic as we enter the fourth quarter.
Final Thoughts
Long-term investing remains one of the most effective ways to build wealth. By focusing on fundamental trends rather than short-term market fluctuations, investors can harness the power of compounding, navigate inevitable periods of uncertainty, and participate in the growth of the global economy. Patience, consistency, and a long-term perspective continue to be among the most valuable assets an investor can possess.
Disclosures & Definitions
RubinBrown Advisors, LLC is an SEC-registered investment advisor under the Investment Advisers Act of 1940. RubinBrown Advisors, LLC is wholly-owned by RubinBrown LLP.
Views expressed are as of the date(s) referenced, based on the information available at that time, and may change based on market and other conditions. These are the views of the authors’ of this piece and may differ from advisors within RubinBrown Advisors, LLC. Information provided in this email is for informational and educational purposes only, it should not be construed as a specific recommendation of any security, sector or investment strategy. Please contact your investment advisor to discuss your personal portfolio. Investment decisions should be based on an individual or family’s own goals, time horizon and tolerance for risk.
Past performance is no guarantee of future results. Different types of investments involve varying degrees of risk. Therefore, there can be no assurance that the future performance of any specific investment or investment strategy, including the investments and/or investment strategies recommended and/or undertaken by RubinBrown Advisors, will be profitable, equal any corresponding indicated historical performance level(s), be suitable for your portfolio or individual situation, or prove successful. No amount of prior experience or success should be construed that a certain level of results or satisfaction will be achieved if RubinBrown Advisors is engaged, or continues to be engaged, to provide investment advisory services. Moreover, you should not assume that any discussion or information contained in this presentation serves as the receipt of, or as a substitute for, personalized investment advice from RubinBrown Advisors. A copy of our current written disclosure Brochure discussing our advisory services and fees is available upon request or at www.rubinbrownadvisors.com. The scope of the services to be provided depends upon the needs and requests of the client and the terms of the engagement. Please Remember:
These materials contain “forward-looking” information that is not purely historical in nature. Such information may include, among other things, projections, forecasts or estimates of cash flows, yields or returns, scenario analyses and proposed or expected portfolio composition. The forward-looking information contained herein is based upon certain assumptions about future events or conditions and intended only to illustrate hypothetical results under those assumptions (not all of which will be specified herein). Actual events or conditions are unlikely to be consistent with, and may differ materially from, those assumed. In addition, not all relevant events or conditions may have been considered in developing such assumptions. Accordingly, actual results will vary, and the variations may be material. The information included in this report is based upon information reasonably available to RubinBrown as of the date noted herein. RubinBrown believes these sources to be reliable; however, these sources cannot be guaranteed as to their accuracy or completeness. The assets discussed in this report may not represent all your assets. In addition to reviewing this report prepared by RubinBrown please review and rely upon as authoritative account statements received directly from your Custodians, Managers, and/or Administrators.
Historical performance results for investment indices, benchmarks, and/or categories have been provided for general informational/comparison purposes only, and generally do not reflect the deduction of transaction and/or custodial charges, the deduction of an investment management fee, nor the impact of taxes, the incurrence of which would have the effect of decreasing historical performance results. It should not be assumed that your RubinBrown Advisors account holdings correspond directly to any comparative indices or categories. Please Also Note: (1) Performance results do not reflect the impact of taxes; (2) comparative benchmarks/indices may be more or less volatile than your RubinBrown accounts; and (3) a description of each comparative benchmark/index is available upon request.