October 2026 Market and Economic Update
October 2026 Market and Economic Update
Beyond the Bull Run – The Bull Market Turned Four. Now What?
Key Observations
- The Federal Reserve held its target rate at 3.75% to 4.00% in October as strong economic growth and elevated inflation kept policymakers cautious. Even so, Treasury yields retreated from September’s highs, easing pressure on markets.
- U.S. equity leadership shifted sharply. Greater scrutiny of AI-related capital spending weighed on many of the largest technology companies, while small-cap and value stocks moved higher, broadening participation beyond the market’s recent leaders.
- The decline in Treasury yields helped bonds rebound from September’s selloff. With weakness concentrated among large technology stocks, fixed income provided a meaningful source of diversification and helped offset some of the volatility in equities.
- Geopolitical tensions continued to reverberate through energy markets, keeping oil prices elevated and volatile.
Market Recap
October marked a partial reversal of September’s market dynamics. Treasury yields declined as expectations for further Federal Reserve tightening eased, providing relief to bonds and other rate-sensitive assets. At the same time, concerns surrounding AI-related capital spending drove a sharp shift in equity market leadership.
U.S. equity returns were mixed but generally positive. The S&P 500 declined 0.9%, while the Russell 2000 gained 0.6% and the equal-weighted S&P 500 advanced 5.0%. Large technology companies came under pressure as investors placed greater scrutiny on the scale of AI investment and the prospective return on that spending, while small-cap, value, and defensive stocks benefited from the rotation.
International markets told two distinct stories. Developed markets declined 0.7%, while emerging markets fell 8.1%. Emerging markets fell sharply, with weakness concentrated in technology-heavy Asian markets following the reversal in AI-related stocks. Broader declines across several major emerging markets added to the index’s losses.
Fixed income rebounded following September’s selloff. The Bloomberg U.S. Aggregate Bond Index gained 2.4%, while high-yield bonds advanced 0.3%. Falling Treasury yields provided the strongest support to longer-duration securities, allowing core bonds to provide diversification as large-cap technology and emerging-market equities came under pressure.
Real assets also benefited from the shift in interest rates. Listed real estate gained 4.7% as declining Treasury yields eased a key headwind, while commodities were essentially flat. Strength in energy offset weakness elsewhere as continued uncertainty surrounding Iran and Middle East supply routes kept oil prices elevated and volatile.
Celebrating Four Years of the Bull Market
Just over four years ago, the outlook for stocks felt anything but celebratory. Inflation remained stubbornly high, the Federal Reserve was raising interest rates at its fastest pace in decades, and fears of recession were building. By October 12, 2022, the S&P 500 Index had fallen approximately 25% from its January peak. What followed was a remarkable four-year advance, with the S&P 500 Index delivering a cumulative total return of approximately 130% through October 2026. Yet the market’s climb was far from smooth, giving investors plenty of reasons to question whether it could continue. Regional bank failures, persistent inflation, shifting interest-rate expectations, geopolitical tensions, and tariff uncertainty all interrupted the advance. Through every setback, however, the stock market recovered and the bull market charged on.
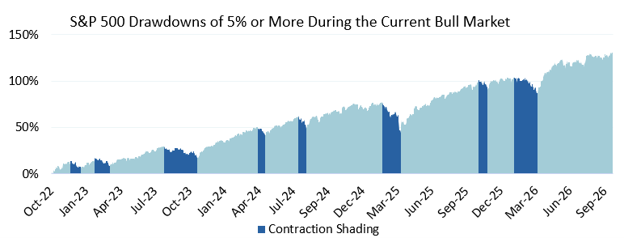 Source: Morningstar Direct. As of October 12, 2026. Contraction shading represents a peak-to-trough decline of 5% or more, measured from the preceding market high to the subsequent low.

With four years of gains now in the rearview mirror, recency bias can make the market’s strength feel normal and a continued rise seem more likely. This anniversary offers an opportunity to look beyond the headline return and examine what has driven the advance, how it compares with past bull markets, and how several years of gains can shape investor behavior.
Bull Markets Don’t Run on a Timer
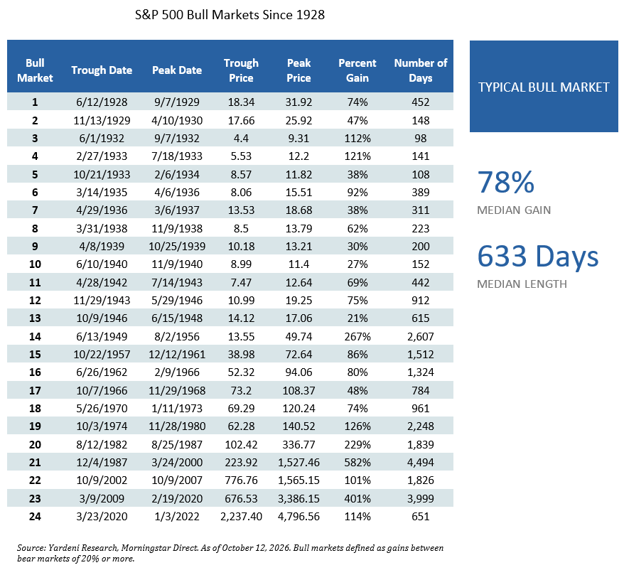
Since 1928, the median bull market has delivered a price gain of 78% over 633 calendar days. Through its four-year anniversary, the current advance has exceeded both measures. Does that mean the current advance has run its course? Not necessarily. Historical averages provide useful context, but they should not be treated as a countdown.
Bull markets have varied widely in length and magnitude, with some lasting only months and others continuing for more than a decade. That variation has also not been evenly distributed across history. Bull markets were generally shorter in the market’s earlier decades, particularly around the Great Depression and World War II, while those beginning after the 1950s have tended to last longer and, in several cases, deliver substantially larger gains.
The shift likely reflects a combination of forces. First, U.S. economic expansions have lasted an average of more than five years since World War II, roughly twice as long as those in the earliest part of the historical record, giving corporate earnings more time to grow and compound. Monetary policy also became a more active stabilizing force as the Federal Reserve gained greater independence and, in turn, was able to respond more effectively to periods of economic weakness. Technological advances also opened new avenues for productivity and profit growth. Later, from the mid-1980s through 2007, the Great Moderation brought greater stability to economic growth and inflation, creating a steadier backdrop for businesses and markets.
The shift likely reflects a combination of forces. First, U.S. economic expansions have lasted an average of more than five years since World War II, roughly twice as long as those in the earliest part of the historical record, giving corporate earnings more time to grow and compound. Monetary policy also became a more active stabilizing force as the Federal Reserve gained greater independence and, in turn, was able to respond more effectively to periods of economic weakness. Technological advances also opened new avenues for productivity and profit growth. Later, from the mid-1980s through 2007, the Great Moderation brought greater stability to economic growth and inflation, creating a steadier backdrop for businesses and markets.
A bull market’s durability depends less on its age and more on the conditions supporting it. Economic growth, rising corporate earnings, and supportive financial conditions are all far more important factors than timing. Pressure emerges when the earnings outlook weakens, the price investors are willing to pay for those earnings declines, or both. The dot-com bubble was largely a story of valuation. By 2000, technology stock prices reflected growth expectations that many companies struggled to justify. Valuations also reset sharply in 2022, though for a different reason. Persistent inflation incited aggressive Federal Reserve rate hikes, raised borrowing costs, weakened the economic outlook, and reduced what investors were willing to pay for future earnings. Neither bull market ended because of its age. Both ended when the conditions supporting stock prices changed.
The Bull Market Enters Year Five
As the bull market enters its fifth year, the next phase will depend on the economic and earnings conditions beneath it. For now, both remain supportive. Real GDP expanded at a 3.4% annualized rate in the third quarter of 2026, accelerating from 2.2% in the second quarter. Meanwhile, the S&P 500 is reporting blended earnings growth of approximately 30% for the third quarter, with 60% of companies having reported. If sustained, this would mark the third consecutive quarter of earnings growth above 25% and the eighth consecutive quarter of double-digit growth.
However, strong fundamentals do not eliminate the risk of setbacks. Elevated market expectations leave less room for disappointment, particularly among companies whose valuations hinge on the continued pace of the AI buildout. The market also remains heavily influenced by a relatively small group of leading companies, magnifying the potential effect if their results fall short of expectations. Geopolitical tensions, renewed inflation, or an unexpected shift in economic conditions could further challenge the advance.
Hindsight is 20/20, and neither the market’s current strength nor the risks surrounding it can tell us when this bull market will end. Rather than trying to time the turning point, investors should focus on what they can control: their behavior and the composition of their portfolios.
When Fear of Loss Gives Way to Fear of Missing Out
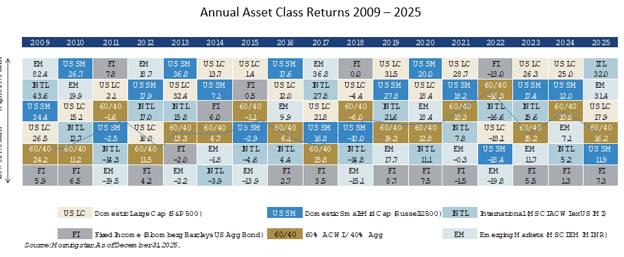
As gains accumulate in a bull market, fear of loss can give way to fear of missing out (FOMO), drawing investors toward the assets that have already performed best. Yet the return rankings below show how quickly leadership can change, even from one year to the next.
The bull market’s fourth anniversary offers an opportunity to step back and consider how portfolios have evolved over several years of equity market gains:
-
Have strong returns pushed individual investments above their intended weights?
-
Is the portfolio more dependent on a smaller group of companies or market segments than intended?
-
Most importantly, does the portfolio still reflect its long-term objectives and intended level of risk?
Diversification can be difficult to appreciate when the market appears to have already identified the “winners.” Investors naturally want more exposure to what is working and less to what is not, but following recent leaders can leave a portfolio increasingly dependent on the conditions that fueled their success. The historical data offers a valuable reminder that no asset class remains on top indefinitely, and there is no reliable pattern for when leadership will change. Just as a bull market’s age cannot tell us when it will end, recent returns cannot tell us what will lead next. Markets rarely announce when leadership is about to shift. A strong bull market is an opportunity to step back, consider what has changed within a portfolio, and assess whether it remains properly aligned with its stated objectives.
Disclosures & Definitions
RubinBrown Advisors, LLC is an SEC-registered investment advisor under the Investment Advisers Act of 1940. RubinBrown Advisors, LLC is wholly-owned by RubinBrown LLP.
Views expressed are as of the date(s) referenced, based on the information available at that time, and may change based on market and other conditions. These are the views of the authors’ of this piece and may differ from advisors within RubinBrown Advisors, LLC. Information provided in this email is for informational and educational purposes only, it should not be construed as a specific recommendation of any security, sector or investment strategy. Please contact your investment advisor to discuss your personal portfolio. Investment decisions should be based on an individual or family’s own goals, time horizon and tolerance for risk.
Past performance is no guarantee of future results. Different types of investments involve varying degrees of risk. Therefore, there can be no assurance that the future performance of any specific investment or investment strategy, including the investments and/or investment strategies recommended and/or undertaken by RubinBrown Advisors, will be profitable, equal any corresponding indicated historical performance level(s), be suitable for your portfolio or individual situation, or prove successful. No amount of prior experience or success should be construed that a certain level of results or satisfaction will be achieved if RubinBrown Advisors is engaged, or continues to be engaged, to provide investment advisory services. Moreover, you should not assume that any discussion or information contained in this presentation serves as the receipt of, or as a substitute for, personalized investment advice from RubinBrown Advisors. A copy of our current written disclosure Brochure discussing our advisory services and fees is available upon request or at www.rubinbrownadvisors.com. The scope of the services to be provided depends upon the needs and requests of the client and the terms of the engagement. Please Remember:
These materials contain “forward-looking” information that is not purely historical in nature. Such information may include, among other things, projections, forecasts or estimates of cash flows, yields or returns, scenario analyses and proposed or expected portfolio composition. The forward-looking information contained herein is based upon certain assumptions about future events or conditions and intended only to illustrate hypothetical results under those assumptions (not all of which will be specified herein). Actual events or conditions are unlikely to be consistent with, and may differ materially from, those assumed. In addition, not all relevant events or conditions may have been considered in developing such assumptions. Accordingly, actual results will vary, and the variations may be material. The information included in this report is based upon information reasonably available to RubinBrown as of the date noted herein. RubinBrown believes these sources to be reliable; however, these sources cannot be guaranteed as to their accuracy or completeness. The assets discussed in this report may not represent all your assets. In addition to reviewing this report prepared by RubinBrown please review and rely upon as authoritative account statements received directly from your Custodians, Managers, and/or Administrators.
Historical performance results for investment indices, benchmarks, and/or categories have been provided for general informational/comparison purposes only, and generally do not reflect the deduction of transaction and/or custodial charges, the deduction of an investment management fee, nor the impact of taxes, the incurrence of which would have the effect of decreasing historical performance results. It should not be assumed that your RubinBrown Advisors account holdings correspond directly to any comparative indices or categories. Please Also Note: (1) Performance results do not reflect the impact of taxes; (2) comparative benchmarks/indices may be more or less volatile than your RubinBrown accounts; and (3) a description of each comparative benchmark/index is available upon request.