Back to News & Insights
Rates Set the Price, Liquidity Sets the Terms
Rates Set the Price, Liquidity Sets the Terms
Rates Set the Price, Liquidity Sets the Terms
Markets Run Higher Ahead of the Fed
.png "img1-(2).png")
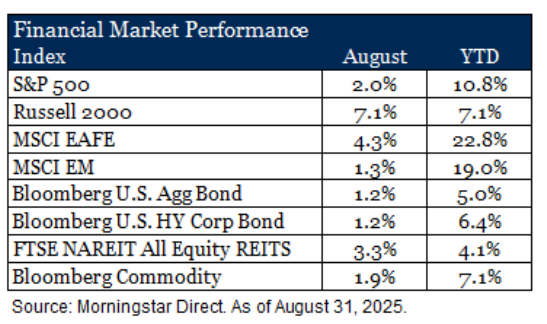
Equities moved higher in August, though leadership shifted beneath the surface. The S&P 500 rose 2.0% and remains up 10.8% year-to-date, but the more notable move came from small caps. The Russell 2000 surged 7.1% in August, erasing earlier weakness as investors grew more comfortable with the prospect of Federal Reserve rate cuts. The rotation also showed up at the sector level. Materials and health care were stand-out sectors within the S&P 500, while technology lagged as A.I. enthusiasm gave way to concerns about rising costs and capital intensity. While the market’s muscle memory to reward growth is still present, August favored value and cyclicals.
Outside the U.S., international equities extended their lead. Developed markets, represented by the MSCI EAFE, advanced 4.3% in August and are now up an outsized 22.8% year-to-date. Japan was a standout, driven by tariff revisions and structural improvements to its economy, while Germany and France trailed the pack. Emerging markets posted a modest 1.3% gain for the month, but remain up 19.0% for the first eight months of the year. Strength in China, supported by targeted policy action, and in Brazil, fueled by strong corporate earnings and attractive valuations, helped offset weaker performance elsewhere.
Fixed income markets also benefited from a shift in tone. Treasury yields fell across the curve after a disappointing unemployment report and dovish messaging out of the Fed’s Jackson Hole summit. Core bonds rose 1.2% in August and high yield added 1.2% with spreads grinding tighter.
Real assets added to the positive momentum. Commodities rose 1.9% as precious metals benefited from questions around U.S. policy credibility and softening confidence in the dollar. REITs gained 3.3% in August as falling rates provided relief. Lodging and resorts led the way, boosted by robust summer travel, while data centers fell behind as investors reassessed capacity and energy usage challenges.
August highlighted the breadth of participation across asset classes. Risk assets pushed higher, credit remained firm, and real assets gained as well. Beneath the headline returns, however, leadership is rotating. Investors are shifting toward areas tied to policy support, lower valuations, and real cash flow, while the expensive corners of growth trade are being tested. This changing mix is worth watching as markets transition from momentum-driven gains to a backdrop increasingly defined by fundamentals.
The Liquidity Cycle Behind Rates
Liquidity is the invisible force that underpins markets. It facilitates price discovery, supports valuations, and suppresses volatility. When liquidity expands, financial conditions ease even if policy rates are unchanged. When liquidity contracts, fragility emerges. The U.S. financial system is moving through a liquidity cycle that began with extraordinary pandemic-era stimulus. Now, the question is whether the unwind can continue.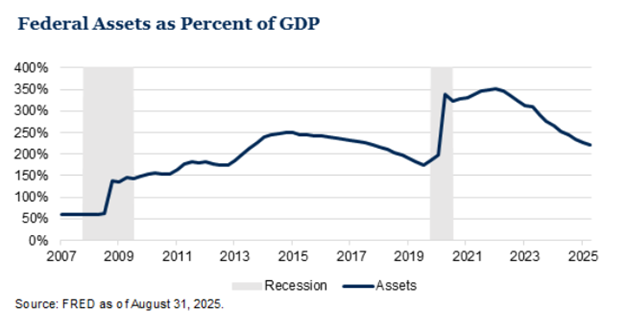.png "img2-(2).png")
The Federal Reserve remains committed to balance sheet runoff. Quantitative tightening (“QT”) by passive maturity is a slow process. Assets roll off month after month, shrinking reserves on the liability side of the balance sheet.
.png "img3-(2).png")
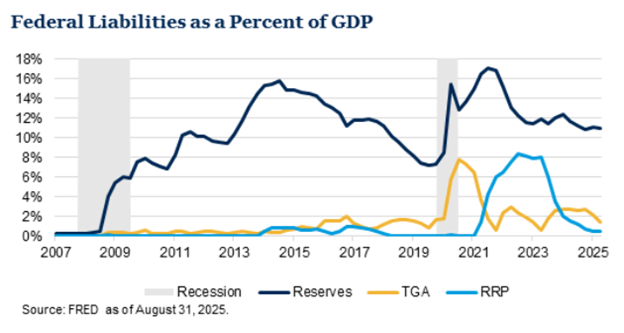
The Reverse Repo Facility (“RRP”) has already absorbed a large portion of excess liquidity during the pandemic. At its peak, RRP held nearly $2.5 trillion of cash seeking collateral. That pool has now been drained, as money markets reallocated to higher yielding treasury bills. At the same time, the Treasury has been rebuilding the Treasury General Account (“TGA”) through issuance to pay maturing assets. Every dollar added to the Treasury’s cash balance is a dollar withdrawn from private sector liquidity.
The next likely source of liquidity to absorb tightening is bank reserves. These have remained elevated relative to history, but the trend is downward. Earlier adjustments have been contained within money markets through facilities like the RRP, but further declines in reserves would shift the impact into the banking system itself.
With the raise of the debt ceiling and increased spending outlined in the “Big Beautiful Bill,” markets must digest not only the Fed’s runoff but also additional Treasury issuance. The implication for the yield curve is likely continued volatility. Thus, the Fed may choose to end QT to avoid over-tightening, an option given balance sheet assets are currently at a pre-pandemic level.
Outlook
The liquidity cycle is likely entering a more constrained phase, though the Fed does have options to manage its position. For investors, the takeaway is clear. Fragility may rise in markets, which would call for durable portfolios through diversification. In this environment, exposure to active management is helpful in navigating a world where broader market forces, not just rates, define the environment.Disclosures & Definitions
Views expressed are as of the date(s) referenced, based on the information available at that time, and may change based on market and other conditions. These are the views of the authors’ of this piece and may differ from other advisors within RubinBrown Advisors, LLC. RubinBrown Advisors does not assume any duty to update any of the information. Sources used and referenced in preparing this commentary are deemed to be reliable, but RubinBrown Advisors has not verified their accuracy. Information provided in this email is for informational and educational purposes only, it should not be construed as a specific recommendation of any security, sector or investment strategy. Please contact your investment advisor to discuss your personal portfolio. Investment decisions should be based on an individual or family’s own goals, time horizon and tolerance for risk.
RubinBrown Advisors, LLC is an SEC-registered investment advisor under the Investment Advisers Act of 1940. RubinBrown Advisors, LLC is wholly-owned by RubinBrown LLC. Comparisons to any indices referenced herein are for illustrative purposes only and are not meant to imply that actual returns or volatility will be similar to the indices. Indices cannot be invested in directly. Unmanaged index returns assume reinvestment of any and all distributions and do not reflect our fees or expenses. Market returns shown in text are as of the publish date and source from Morningstar or FactSet unless otherwise listed.
• The S&P 500 is a capitalization-weighted index designed to measure performance of the broad domestic economy through changes in the aggregate market value of 500 stocks representing all major industries.
• Russell 2000 consists of the 2,000 smallest U.S. companies in the Russell 3000 index.
• MSCI EAFE is an equity index which captures large and mid-cap representation across Developed Markets countries around the world, excluding the U.S. and Canada. The index covers approximately 85% of the free float-adjusted market capitalization in each country.
• MSCI Emerging Markets captures large and mid-cap representation across Emerging Markets countries. The index covers approximately 85% of the free-float adjusted market capitalization in each country.
• Bloomberg U.S. Aggregate Index covers the U.S. investment grade fixed rate bond market, with index components for government and corporate securities, mortgage pass-through securities, and asset-backed securities.
• Bloomberg U.S. Corporate High Yield Index covers the universe of fixed rate, non-investment grade debt. Eurobonds and debt issues from countries designated as emerging markets (sovereign rating of Baa1/BBB+/BBB+ and below using the middle of Moody’s, S&P, and Fitch) are excluded, but Canadian and global bonds (SEC registered) of issuers in non-EMG countries are included.
• FTSE NAREIT Equity REITs Index contains all Equity REITs not designed as Timber REITs or Infrastructure REITs.
• Bloomberg Commodity Index is calculated on an excess return basis and reflects commodity futures price movements. The index rebalances annually weighted 2/3 by trading volume and 1/3 by world production and weight-caps are applied at the commodity, sector and group level for diversification.
Material Risks
• Fixed Income securities are subject to interest rate risks, the risk of default and liquidity risk. U.S. investors exposed to non-U.S. fixed income may also be subject to currency risk and fluctuations.
• Cash may be subject to the loss of principal and over longer periods of time may lose purchasing power due to inflation.
• Domestic Equity can be volatile. The rise or fall in prices take place for a number of reasons including, but not limited to changes to underlying company conditions, sector or industry factors, or other macro events. These may happen quickly and unpredictably.
• International Equity can be volatile. The rise or fall in prices take place for a number of reasons including, but not limited to changes to underlying company conditions, sector or industry impacts, or other macro events. These may happen quickly and unpredictably. International equity allocations may also be impacted by currency and/or country specific risks which may result in lower liquidity in some markets.
• Real Assets can be volatile and may include asset segments that may have greater volatility than investment in traditional equity securities. Such volatility could be influenced by a myriad of factors including, but not limited to overall market volatility, changes in interest rates, political and regulatory developments, or other exogenous events like weather or natural disaster.
• Private Real Estate involves higher risk and is suitable only for sophisticated investors. Real estate assets can be volatile and may include unique risks to the asset class like leverage and/or industry, sector or geographical concentration. Declines in real estate value may take place for a number of reasons including, but are not limited to economic conditions, change in condition of the underlying property or defaults by the borrower.
All investing involves risk including the potential loss of principal. Market volatility may significantly impact the value of your investments. Recent tariff announcements may add to this volatility, creating additional economic uncertainty and potentially affecting the value of certain investments. Tariffs can impact various sectors differently, leading to changes in market dynamics and investment performance. You should consider these factors when making investment decisions. We recommend consulting with a qualified financial adviser to understand how these risks may affect your portfolio and to develop a strategy that aligns with your financial goals and risk tolerance