July 2026 Market Update
July 2026 Market Update
A Volatile July, A Broader Market
Market leadership broadened even as inflation, rates and geopolitical risks weighed on sentiment
Key Observations
- July was a volatile month as investors weighed strong corporate earnings against renewed concerns about AI-related valuations, heavy capital spending, and the durability of the recent growth-led rally.
- The Federal Reserve held rates steady at 3.50% to 3.75%, but three dissents in favor of a hike and a continued focus on elevated inflation pushed Treasury yields higher and pressured rate-sensitive areas of the market.
- Market leadership continued to broaden as value-oriented sectors, real assets, and select non-U.S. equities held up better than mega-cap growth, while Middle East tensions and higher oil prices reinforced the importance of diversified portfolio exposures.
Market Recap
July served as a reminder that markets continue to navigate a complex environment where economic resilience, persistent inflation pressures, evolving monetary expectations, and geopolitical developments all compete for investor attention. An escalation in tensions involving Iran contributed to higher energy prices and increased volatility late in the month, while investors also digested another Federal Reserve meeting with mixed signals and lack of clarity on the direction of policy. The Federal Open Market Committee voted to keep the federal funds rate unchanged at 3.50% to 3.75%, though a notable number of policymakers favored tighter policy, leading Treasury yields to move higher and weighing on interest rate sensitive asset classes.
U.S. equities finished modestly lower, but performance broadened beneath the surface. The S&P 500 declined 0.1% for the month, giving back a portion of its strong year-to-date gains, while the Russell 2000 fell 3.0% as rising bond yields and tighter financial conditions created a headwind for smaller cap companies. The market's leadership continued to rotate away from some of the largest growth-oriented stocks that had led earlier in the year, while investors favored sectors tied to energy, financials and more value-oriented areas of the market.
International developed equities delivered positive results despite the uncertain environment. The MSCI EAFE Index gained 2.0%, supported by strength across parts of Europe and the United Kingdom, where equity markets benefited from relatively attractive valuations. A weaker U.S. dollar also provided a modest tailwind for U.S.-based investors. Emerging markets faced a more difficult month. The MSCI Emerging Markets Index declined 3.1%, driven largely by weakness in several technology-heavy Asian markets as investors reassessed growth expectations and semiconductor-related shares experienced a significant pullback after a strong first half of the year.
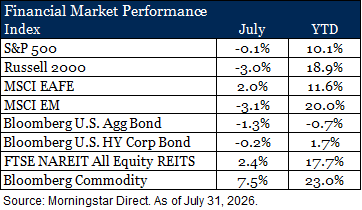
Fixed income markets struggled as yields moved higher following the July FOMC meeting. The Bloomberg U.S. Aggregate Bond Index fell 1.3%, reflecting pressure across both Treasury and investment-grade corporate bonds. The market had mixed interpretation of the Fed's messaging, particularly with inflation remaining above target and energy prices rising amid Middle East tensions. Credit markets proved relatively resilient. The Bloomberg U.S. Corporate High Yield Index slipped just 0.2%, as healthy corporate fundamentals and limited default activity helped offset the impact of rising rates.
Real assets were among the strongest performers during the month. The FTSE NAREIT All Equity REITs Index gained 2.4%, supported by continued strength in data center, industrial and specialized property sectors. Commodities delivered the best performance among major asset classes, with the Bloomberg Commodity Index rising 7.5%.
Small Cap Equities Providing Diversification Benefit
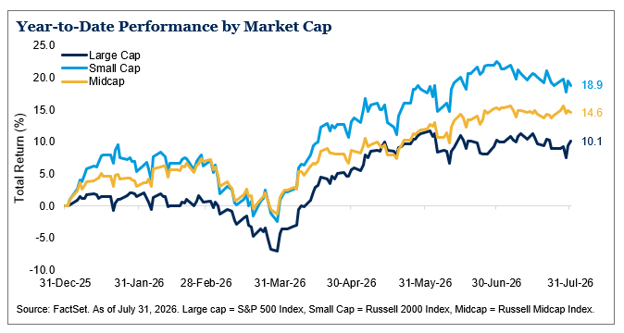
There is a growing concern about AI concentration and elevated valuations within the U.S. large-cap equity market. Diversifying portfolios through exposure to U.S. small- and mid-cap equities, as well as non-U.S. equities, remains important. These companies were expected to be part of the AI flywheel, benefiting from the adoption and use of AI despite not being the direct builders of the technology. Attractive relative valuations of small cap relative to large further supported the case for allocating. Enthusiasm for AI has been a tremendous tailwind for many large cap companies, but growing concerns about valuations and the path to monetization of extreme capex spending has put pressure on some of the mega cap names that have led the market over recent years. Seven months into the year, the benefits of maintaining diversified portfolio exposures have become evident, with small- and mid-cap stocks gaining 18.9% and 14.6%, respectively, versus a 10.1% gain for large-cap stocks.
Outlook
This year has reinforced the importance of remaining diversified as market leadership has continued to broaden beyond the largest U.S. companies. The strong relative performance of small- and mid-cap equities year to date highlights that investors do not need to rely solely on the largest AI beneficiaries to participate in the next phase of the cycle. As AI-related investment spreads across the economy, smaller companies, non-U.S. equities and real assets may all play a role in capturing a broader set of opportunities. With valuations still elevated in parts of the market, interest rates remaining high and geopolitical risks unresolved, the case for balanced portfolios remains strong. Such portfolios can participate in broadening market leadership while maintaining exposure to high-quality managers and a diversified mix of asset classes.
Disclosures & Definitions
RubinBrown Advisors, LLC is an SEC-registered investment advisor under the Investment Advisers Act of 1940. RubinBrown Advisors, LLC is wholly-owned by RubinBrown LLP.
Views expressed are as of the date(s) referenced, based on the information available at that time, and may change based on market and other conditions. These are the views of the authors’ of this piece and may differ from advisors within RubinBrown Advisors, LLC. Information provided in this email is for informational and educational purposes only, it should not be construed as a specific recommendation of any security, sector or investment strategy. Please contact your investment advisor to discuss your personal portfolio. Investment decisions should be based on an individual or family’s own goals, time horizon and tolerance for risk.
Past performance is no guarantee of future results. Different types of investments involve varying degrees of risk. Therefore, there can be no assurance that the future performance of any specific investment or investment strategy, including the investments and/or investment strategies recommended and/or undertaken by RubinBrown Advisors, will be profitable, equal any corresponding indicated historical performance level(s), be suitable for your portfolio or individual situation, or prove successful. No amount of prior experience or success should be construed that a certain level of results or satisfaction will be achieved if RubinBrown Advisors is engaged, or continues to be engaged, to provide investment advisory services. Moreover, you should not assume that any discussion or information contained in this presentation serves as the receipt of, or as a substitute for, personalized investment advice from RubinBrown Advisors. A copy of our current written disclosure Brochure discussing our advisory services and fees is available upon request or at www.rubinbrownadvisors.com. The scope of the services to be provided depends upon the needs and requests of the client and the terms of the engagement. Please Remember:
These materials contain “forward-looking” information that is not purely historical in nature. Such information may include, among other things, projections, forecasts or estimates of cash flows, yields or returns, scenario analyses and proposed or expected portfolio composition. The forward-looking information contained herein is based upon certain assumptions about future events or conditions and intended only to illustrate hypothetical results under those assumptions (not all of which will be specified herein). Actual events or conditions are unlikely to be consistent with, and may differ materially from, those assumed. In addition, not all relevant events or conditions may have been considered in developing such assumptions. Accordingly, actual results will vary, and the variations may be material. The information included in this report is based upon information reasonably available to RubinBrown as of the date noted herein. RubinBrown believes these sources to be reliable; however, these sources cannot be guaranteed as to their accuracy or completeness. The assets discussed in this report may not represent all your assets. In addition to reviewing this report prepared by RubinBrown please review and rely upon as authoritative account statements received directly from your Custodians, Managers, and/or Administrators.
Historical performance results for investment indices, benchmarks, and/or categories have been provided for general informational/comparison purposes only, and generally do not reflect the deduction of transaction and/or custodial charges, the deduction of an investment management fee, nor the impact of taxes, the incurrence of which would have the effect of decreasing historical performance results. It should not be assumed that your RubinBrown Advisors account holdings correspond directly to any comparative indices or categories. Please Also Note: (1) Performance results do not reflect the impact of taxes; (2) comparative benchmarks/indices may be more or less volatile than your RubinBrown accounts; and (3) a description of each comparative benchmark/index is available upon request.