2025 Midyear Outlook
2025 Midyear Outlook
2025 Themes
2025 Midyear Outlook
Top concerns heading into 2025 were full valuations, index concentration in U.S. equities and the risk of reigniting inflation.
A wave of executive orders, Liberation Day and sweeping fiscal legislation aimed at reshaping the post–World War II economic order created a period of change. Volatility spiked in April as investors tried to digest shifting policies on what often felt like comically fast-moving “facts.” As cooler heads prevailed, both in Washington and in the markets, volatility subsided and markets rebounded. For now, investors appear to have grown comfortable with being uncomfortable.
Still, we remain in the early stages of potential significant and lasting shifts in economic policy. In moments like these, we rely on first order principles that guide our thinking and support our actions:
- Diversify with Intent, Not by Default - Diversification is not about owning a little of everything; it is about aligning your long-term tolerance for risk with the humility that the future remains unknowable. Be selective, be thoughtful and above all, be humble in times of change.
- Time Is Your Ally - Compounding is the 8th wonder of the world, but only if you give it time. A long-term lens reveals value and reduces the noise that derails short-term thinkers.
- Compensated for Calm - In times of uncertainty, markets test temperament even more than intelligence. When fear grips others, your discipline becomes your advantage.
In the following pages, we outline key developments across markets and asset classes as part of this mid-year check-in. This is not a comprehensive review of every allocation, but rather a focused look at where things stand. As always, if you have questions about your portfolio or anything not covered here, please reach out to your advisor. We are always happy to discuss it. Enjoy!
Economic Backdrop: From Liberation To Limbo
Economic Balance Sheet Diffusion Index

Strategas as of June 27, 2025
| Assets | Neutral | Liabilities |
| Employment | Consumer Spending Business Confidence Price Inflation Credit Environment Wage Inflation Manufacturing Nonresidential Construction Interest Rate Environment Capital Expenditures |
Housing Consumer Confidence Government Deficit Trade Deficit |
After a year of economic shocks and stabilizers, we remain in what can best be described as the “messy middle.” Lagging data continues to sort through the noise: an early-year surge in consumer and business spending to get ahead of tariffs, followed by a pullback as demand softened. As Strategas’ economic diffusion index shows, many parts of the economy are idling in neutral, waiting for the right push to either accelerate or slip back. On the positive side, the One Big Beautiful Bill (OBBB) blocks a $400 billion tax hike set for January 2026, delivers targeted consumer aid and provides pro-growth incentives to boost domestic manufacturing. On the negative side, the Fed remains firmly in restrictive territory amid ongoing policy uncertainty. Meanwhile, consumers, the engine of the post-COVID recovery, appear to be running low on fuel to sustain spending. Additionally, while the pro-growth measures in the OBBB support near-term activity, they also exacerbate the U.S.’s already high deficit and debt levels, continuing to pressure the dollar and adding to potential volatility.
Economic Backdrop: Policy Uncertainty Creates Mixed Economic Signals
Small Business Optimism and Consumer Confidence

Sources: FactSet, NFIB, Conference Board. As of June 30, 2025
So far in 2025, the U.S. economy has shown a clear divergence between “soft” and “hard” data. This split has created uncertainty around growth prospects, labor market strength and the future of monetary policy. Soft data, drawn from surveys of businesses and consumers, has weakened this year as concerns surrounding inflation, high interest rates, geopolitical tensions and slowing demand weigh on sentiment. These indicators suggest that policy uncertainty, particularly around tariffs, has made businesses and households more cautious and more inclined to anticipate weaker activity ahead.
U.S. GDP and Unemployment Rate

Sources: FactSet, BEA, BLS. As of June 30, 2025. June 2025 GDP value is an estimate.
In contrast, hard data such as GDP growth, payroll gains and retail sales has held up relatively well. The labor market continues to add jobs albeit at a slower pace, but unemployment has remained steady over the past 12 months. Inflation has remained within a narrow range even as trade policy changes begin to ripple through the economy. A negative GDP reading in the first quarter raised alarms, largely due to a surge in imports ahead of tariffs. Since then, expectations have turned positive. Corporate profits remain up year over year, businesses are benefiting from front-loaded demand and the recently passed One Big Beautiful Bill is expected to deliver further support to economic activity in the coming quarters.
Economic Backdrop: Building Bookends
Duration of US Free Trade Agreement Negotiations

Source: World Economic Forum, Apollo Chief Economist. As of April 2025.
The tariffs announced in April were quickly placed on a 90-day reprieve, buying time for negotiations but leaving markets on edge. Historically, trade deals take far longer than 90 days to resolve as noted above, making the short window unusually ambitious. As the reprieve nears its end, where does the U.S. realistically stand? So far, the U.S. has finalized a deal with the United Kingdom, one of the few trading partners that runs a trade surplus with the U.S., which was a key factor in the original tariff calculus. That agreement set tariffs at 10%, which we view as a reasonable floor for future negotiations. At the other extreme, the U.S. is rumored to have struck a deal with Vietnam that imposed a 20% tariff, along with an additional 40% on transshipped goods. Given Vietnam’s significant trade deficit with the U.S., its close economic ties to China and its limited bargaining leverage, this outcome likely represents the ceiling. For most other trading partners, China being a notable exception, tariff rates are likely to fall somewhere between these two. Many details remain unresolved; however, recent deals provide investors with a clearer framework. By establishing realistic bookends, they may help reduce some of the uncertainty that weighed on markets in April.
Global Asset Classes
Fixed Income: Conflicting Valuation Signals

Source: FactSet. As of June 30, 2025.YTW = Yield to Worst, OAS = Option Adjusted Spread Cash = Bloomberg 1-3 Month U.S. Treasury Bills Index; Short = Bloomberg US Government/Credit 1-3 Year Index; Long = Bloomberg US Government/Credit Long Index; Agg = Bloomberg US Aggregate Index; IG Corp = Bloomberg US Corporate Investment Grade Index; HY Corp = Bloomberg US Corporate High Yield Index; Muni = Bloomberg Municipal Bond Index; Muni HY = Bloomberg Municipal Bond High Yield Index; TIPS = Bloomberg US Treasury Inflation Protected Securities Index. Yield is based on yield to worst and spread is option adjusted spread in basis points. See disclosures for list of indices representing each asset class. Past performance does not indicate future performance and there is a possibility of a loss. Indices cannot be invested in directly.
Fixed income markets remain broadly attractive. All-in yields, which reflect both the risk-free rate and a credit spread, have declined slightly since the start of the year but are still elevated by historical standards. This relative value is being driven primarily by higher base interest rates rather than by wider credit spreads. In fact, credit spreads are hovering near their tightest levels in the past two decades. Strong corporate fundamentals, a resilient economy and supportive market technicals have all contributed to this compression.
Given this backdrop, we believe a diversified fixed income allocation, anchored by core bonds, offers stability and attractive return potential relative to other asset classes. While tight spreads suggest a more muted outlook for high yield, all-in yields near 7% remain compelling.
Fixed Income: Imperfect Independence
May 2026 ends Federal Reserve Chair Jerome Powell’s term as chair. While his seat on the Board of Governors ends in 2028, the question of leadership, and by extension Fed independence, is in the spotlight following public disappointment from the executive branch with current rate policy. But it is important not to mistake the chair for a central bank autocrat. Rate decisions at the Fed are made by the 12-member Federal Open Market Committee (FOMC), where each decision requires a majority of seven votes. Even a new chair can’t dictate outcomes in isolation.

Dr. Adriana Kugler’s term will expire in January 2026, offering the President an opportunity to appoint a new governor, presumably the chair, and likely a Dove. Yet committee consensus is still lacking. We believe the market has conflated the President’s authority to appoint versus control. The Fed remains an independent, but not infallible, institution seeking to make important decisions with imperfect information.
Fixed Income: Intermediate Goldilocks
In today’s environment, uncertainty surrounding fiscal and monetary policy, the macroeconomic outlook and shifting investor sentiment continues to drive volatility in interest rates.
Without a clear economic trajectory, some investors may be inclined to favor long-duration assets, given yield advantage and their historical resilience during risk-off periods when interest rates decline. We would caution against this approach. The long end of the yield curve is most exposed to the powerful structural forces shaping today’s markets, including concerns over fiscal sustainability, widening deficits, trade policy shifts, economic growth dynamics and the persistent risk of inflation. These factors are likely to exert outsized influence on long-term yields. Even a modest increase could undermine the current yield advantages. In fact, just a 0.30% rise in long-dated yields would be enough to offset today’s yield cushion.
Potential Return of Fixed Income as Rates Move (+/- 100 Basis Points)

Source: FactSet as of June 30, 2025. Total potential return based on a parallel move in interest rates up or down by 100 basis points. Data based on respective Bloomberg Bellwether Treasury Indices and Bloomberg US Agg Bond Index. YTW = yield to worst. See disclosures for list of indices representing each asset class. Past performance does not indicate future performance and there is a possibility of a loss. Indices cannot be invested in directly.
Instead, core fixed income presents a more balanced and compelling opportunity. It offers an attractive risk- reward profile across a range of outcomes: benefiting if yields fall, holding value if they remain stable and helping cushion portfolios against modest increases. In a market still searching for direction, this “just right” positioning may be the most prudent course for fixed income allocations today.U.S. Equity: Full Valuations
Average Forward 12 Month Return by P/E Tranche

Sources: FactSet as of June 30, 2025. Recession average is 20 year average EPS decline peak to through decline. Consensus growth based on Strategas as of June 30, 2025. 10-yr Avg EPS growth is annual earnings growth from June 30, 2025 to June 30, 2015. Past performance does not indicate future performance and there is a possibility of a loss. Indices cannot be invested in directly.
In their simplest form, index returns can be broadly understood through two components:
- Earnings per Share (EPS): the net economic value generated per share of the index.
- Multiples: the price investors are willing to pay for that economic value.
EPS is generally more stable than multiples and closely tied to the real economy. Multiples, on the other hand, are shaped by investor sentiment and account for much of the day-to-day volatility in index prices. They also act as a forward- looking signal of how investors perceive future prospects.
At current valuation levels, with multiples above 22 times earnings, markets appear fully priced. While high valuations do not guarantee weak future returns, they do raise the bar for continued earnings growth and sustained investor confidence. If either weakens, if earnings disappoint or if sentiment falls, the path forward becomes less compelling.
In this context, rebalancing is potentially advantageous. By trimming exposure to areas that have performed well over the last several years and reallocating to parts of the market with more favorable relative valuations, investors can better prepare portfolios for a less certain road ahead.
Global Equity: International Markets Shine
Non-U.S. equities are off to a strong start, with the MSCI EAFE Index climbing nearly 20% year to date. This marks the best absolute and relative performance versus the S&P 500 over the first half of a year in the past two decades. A weaker U.S. dollar has contributed meaningfully, but it is not the entire story.
Markets across developed and emerging regions have outpaced the U.S. even in local currency terms. Attractive valuations abroad, looser monetary policy, increased defense spending in Europe and targeted stimulus in China have all supported investor confidence. These tailwinds have driven strong year-to-date local returns in markets such as Germany, Italy, the UK, France, Korea and China.

Source: Morningstar Direct. As of June 30, 2025. Returns are based on January 1 - June 30 for each
The natural question that follows is whether this outperformance is sustainable. U.S. markets remain a critical growth engine, and we are not suggesting that six months of relative strength marks the beginning of a new secular trend. However, we continue to believe that non-U.S. allocations will play an important role in meeting long-term investment objectives and help mitigate some of the acute risks found in U.S. markets.

Source: Morningstar Direct. As of June 30, 2025. Based on respective USD and local currency MSCI. Use of Indices and Benchmark Return Indices cannot be invested in directly. Index performance is reported gross of fees and expenses and assumes the reinvestment of dividends and capital gains. Past performance does not indicate future performance and there is a possibility of a loss. See disclosure page for indices representing each asset class
U.S. Dollar: Don’t Conflate Price & Reserve Status
The U.S. dollar’s weakness in 2025, alongside notable shifts in policy, has prompted some to question whether it can maintain its role as the world’s primary reserve currency. It is a fair question. Reserve status is earned, not guaranteed, and the U.S. fiscal outlook does little to instill long-term confidence. Still, it is important to distinguish between short-term currency movements and the structural foundations of reserve status.
U.S. Dollar Index (DXY)

Source: FactSet. As of June 30, 2025.
As the above chart shows, the dollar has declined 11% year to date. Even so, it remains well above historical lows and above its long-term average going back to the mid-1980s. Throughout that entire period, the U.S. dollar has continued to serve as the world’s dominant reserve asset. That is because reserve currency status is supported by much more than market price.
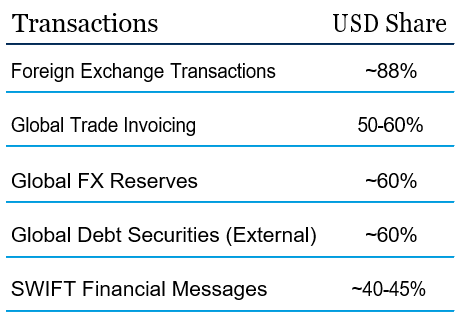
The scale and depth of the U.S. economy and financial markets are central. The dollar remains the most widely used currency for global trade and capital flows, holding a commanding share of international transactions.
Beyond economic factors, legal and political stability, as well as U.S. military and diplomatic influence, act as powerful reinforcements. These institutional advantages create structural resilience that rivals cannot easily replicate. In short, while the dollar may weaken at times, we believe its role as the world’s reserve currency is likely to remain intact.
.png "trans-(1).png")
Source: 1) NY Federal Reserve BIS Triennial Survey as of Nov, 2022. 2) IMF Working Paper Mar 31, 2025. 3) IMF COFER, as of Mar 31, 2025. 4) BIS Quarterly Review (2023), World Bank (2023). 5) SWIFT RMB Tracker, as of Mar 31, 2025
One Big Beautiful Bill (OBBB)
Congress has passed the sweeping One Big Beautiful Bill Act of 2025, a nearly 900-page budget reconciliation and tax reform package. The legislation cements several campaign promises, makes permanent key tax cuts and introduces new growth incentives, all while adding to already elevated deficits. Regulatory agencies, including Treasury and the IRS, are expected to issue further guidance in the coming months.
Below are highlights of the most relevant provisions:
- 2017 Tax Cuts Made Permanent — Congress to avert a projected $400 billion tax hike in 2026 by making the 2017 tax rates, higher standard deduction, AMT relief and estate/gift tax changes permanent. Any future changes will now require Congressional action.
- Campaign-Driven Tax Relief — Delivering on campaign pledges, the bill eliminates federal taxes on tips, Social Security benefits, overtime pay and auto loan interest, measures expected to free up roughly $80 billion for consumers in early 2026.
- Estate Tax Changes Expanded — In addition to preserving 2017 changes, the estate tax exemption receives another increase, further reducing exposure for high-net-worth households.
- Full Expensing & Interest Deductions — Corporations can fully expense capital equipment, R&D costs and factory construction through looser limits on deductible interest aimed at fueling a U.S. “building boom.”
- Targeted Spending Cuts — The package calls for $1.3–$1.6 trillion in cuts over the next decade, focused on renewable energy programs, Medicaid (with most cuts delayed until after 2028), food assistance and student loans.
- Debt Ceiling Increased — With unified Republican control, the debt ceiling was raised by $5 trillion without the typical brinkmanship, leaving Treasury to manage a deficit approaching 6% of GDP as post-pandemic liquidity measures expire.
On balance, the OBBB delivers a dose of fiscal stimulus, likely supporting near-term equity sentiment while reinforcing pro-growth business conditions. At the same time, it worsens already elevated deficits with spending levels which are typically only seen during recessions. Bond markets have already reacted to this tension, with long-term rates showing renewed volatility. However, this type of frivolously spending is not a new trick for politicians as deficits have grown under both parties over multiple decades.
Federal Surplus/Deficit (millions)

Source: Federal Reserve Economic Data Bank of Saint Louis as of June 30, 2025
Disclosures
Views expressed are as of the date(s) referenced, based on the information available at that time, and may change based on market and other conditions. These are the views of the authors’ of this piece and may differ from other advisors within RubinBrown Advisors, LLC. RubinBrown Advisors does not assume any duty to update any of the information. Sources used and referenced in preparing this commentary are deemed to be reliable, but RubinBrown Advisors has not verified their accuracy. Information provided in this email is for informational and educational purposes only, it should not be construed as a specific recommendation of any security, sector or investment strategy. Please contact your investment advisor to discuss your personal portfolio. Investment decisions should be based on an individual or family’s own goals, time horizon and tolerance for risk.
RubinBrown Advisors, LLC is an SEC-registered investment advisor under the Investment Advisers Act of 1940. RubinBrown Advisors, LLC is wholly-owned by RubinBrown LLC.
Comparisons to any indices referenced herein are for illustrative purposes only and are not meant to imply that actual returns or volatility will be similar to the indices. Indices cannot be invested in directly. Unmanaged index returns assume reinvestment of any and all distributions and do not reflect our fees or expenses.
When referencing asset class returns or statistics, the following indices are used to represent those asset classes, unless otherwise noted. Each index is unmanaged, and investors can not actually invest directly into an index:
Domestic equity returns based on the following indices: Large Value: Russell 1000 Value TR USD, Large Core: Russell 1000 TR USD, Large Growth: Russell 1000 Growth TR USD, Mid Value: Russell Mid Cap Value TR USD, Mid Core: Russell Mid Cap TR USD, Mid Growth: Russell Mid Cap Growth TR USD, Small Value: Russell 2000 Value TR USD, Small Core: Russell 2000 TR USD, Small Growth: Russell 2000 Growth TR USD
Factor returns based on the following indices: Earnings Yield: MSCI USA Barra Earnings Yield NR USD, Low Leverage: MSCI USA Barra Low Leverage NR USD, Low Volatility: MSCI USA Barra Low Volatility NR USD, Momentum: MSCI USA Barra Momentum NR USD, Value: MSCI USA Barra Value NR USD
S&P 500 sector performance based on the following indices: S&P 500 Sec/Commun Services TR USD, S&P 500 Sec/Financials TR USD, S&P 500 Sec/Energy TR USD, S&P 500 Sec/Industrials TR USD, S&P 500 TR USD, S&P 500 Sec/Health Care TR USD, S&P 500 Sec/Cons Disc TR USD, S&P 500 Sec/Utilities TR USD, S&P 500 Sec/Cons Staples TR USD, S&P 500 Sec/Materials TR USD, S&P 500 Sec/Information Technology TRUSD, S&P 500 Sec/Real Estate TR USD
International Developed equity returns based on the following indices: Large Value: MSCI EAFE Large Value NR USD, Large Core: MSCI EAFE Large NR USD, Large Growth: MSCI EAFE Large Growth NR USD, Mid Value: MSCI EAFE Mid Value NR USD, Mid Core: MSCI EAFE Mid NR USD, Mid Growth: MSCI EAFE Mid Growth NR USD, Small Value: MSCI EAFE Small Value NR USD, Small Core: MSCI EAFE Small Cap NR USD, Small Growth: MSCI EAFE Small Growth NR USD
International equity returns based on the following indices: Large Value: MSCI ACWI ex USA Large Value NR USD, Large Core: MSCI ACWI ex USA Large NR USD, Large Growth: MSCI ACWI ex USA Large Growth NR USD, Mid Value: MSCI ACWI ex USA Mid Value NR USD, Mid Core: MSCI ACWI ex USA Mid NR USD, Mid Growth: MSCI ACWI ex USA Mid Growth NR USD, Small Value: MSCI ACWI ex USA Small Value NR USD, Small Core: MSCI ACWI ex USA Small NR USD, Small Growth: MSCI ACWI ex USA Small Growth NR USD
Emerging Markets equity returns based on the following indices: Large Value: MSCI EM Large Value NR USD, Large Core: MSCI EM Large NR USD, Large Growth: MSCI EM Large Growth NR USD, Mid Value: MSCI EM Mid Value NR USD, Mid Core: MSCI EM Mid NR USD, Mid Growth: MSCI EM Mid Growth NR USD, Small Value: MSCI EM Small Value NR USD, Small Core: MSCI EM Small NR USD, Small Growth: MSCI EM Small Growth NR USD
Equity country returns based on the following indices: Belgium: MSCI Belgium NR USD, Canada: MSCI Canada NR USD, France: MSCI France NR USD, Germany: MSCI Germany NR USD, Italy: MSCI Italy NR USD, Japan: MSCI Japan NR USD, Netherlands: MSCI Netherlands NR USD, Sweden: MSCI Sweden NR USD, Switzerland: MSCI Switzerland NR USD, UK: MSCI United Kingdom NR USD, USA: MSCI USA NR USD, Brazil: MSCI Brazil NR USD, China: MSCI China NR USD, India: MSCI India NR USD, Mexico: MSCI Mexico NR USD, South Korea: MSCI Korea NR USD, ACWI ex US: MSCI ACWI ex USA NR USD, EAFE: MSCI EAFE NR USD, EM: MSCI EM NR USD
Commodity Performance based on the following indices: Energy: Bloomberg Sub Energy TR USD, Industrial Metals: Bloomberg Sub Industrial Metals TR USD, Precious Metals: Bloomberg Sub Precious Metals TR USD, Agriculture: Bloomberg Sub Agriculture TR USD
REIT sector performance is based on the following indices: FTSE Nareit Equity Health Care TR,FTSE Nareit Equity Lodging/Resorts TR, FTSE Nareit Equity Office TR, FTSE Nareit Equity Data Centers TR, FTSE Nareit Equity Diversified TR, FTSE Nareit Equity Specialty TR, FTSE Nareit Equity Retail TR, FTSE Nareit Equity Residential TR, FTSE Nareit Equity Industrial TR, FTSE Nareit Equity Self Storage TR
Disclosures – Index & Benchmark Definitions
Index & Benchmark Definitions
Fixed Income
• Bloomberg 1-3 Month U.S. Treasury Bill Index is designed to measure the performance of public obligations of the U.S. Treasury that have a remaining maturity of greater than or equal to 1 month and less than 3 months.
• Bloomberg U.S. Aggregate Index covers the U.S. investment grade fixed rate bond market, with index components for government and corporate securities, mortgage pass-through securities, and asset-backed securities.
• Bloomberg Global Aggregate ex. USD Indices represent a broad-based measure of the global investment- grade fixed income markets. The two major components of this index are the Pan-European Aggregate and the Asian-Pacific Aggregate Indices. The index also includes Eurodollar and Euro-Yen corporate bonds and Canadian government, agency and corporate securities.
• Bloomberg U.S. Corporate High Yield Index covers the universe of fixed rate, non-investment grade debt. Eurobonds and debt issues from countries designated as emerging markets (sovereign rating of Baa1/BBB+/BBB+ and below using the middle of Moody’s, S&P, and Fitch) are excluded, but Canadian and global bonds (SEC registered) of issuers in non-EMG countries are included.
• Bloomberg US Government/Credit 1-3 Year Index is the 1-3 year component of the U.S. Government/Credit Index, which includes securities in the Government and Credit Indices. The Government Index includes treasuries and agencies, while the credit index includes publicly issued U.S. corporate and foreign debentures and secured notes that meet specified maturity, liquidity, and quality requirements.
• Bloomberg US Government/Credit Long Index is the Long component of the U.S. Government/Credit Index, which includes securities in the Government and Credit Indices. The Government Index includes treasuries and agencies, while the credit index includes publicly issued U.S. corporate and foreign debentures and secured notes that meet specified maturity, liquidity and quality requirements.
• Bloomberg US Treasury Inflation Protected Securities Index consists of Inflation-Protection securities issued by the U.S. Treasury.
• Bloomberg Muni Index is a rules-based, market-value-weighted index engineered for the long-term tax-exempt bond market. Bonds must be rated investment-grade by at least two ratings agencies.
• Bloomberg High Yield Municipal Bond Index covers the universe of fixed rate, non-investment grade debt.
• Bloomberg Intermediate U.S. Gov’t/Credit is the Intermediate component of the U.S. Government/Credit index, which includes securities in the Government and Credit Indices. The Government Index includes treasuries and agencies, while the credit index includes publicly issued U.S. corporate and foreign debentures and secured notes that meet specified maturity, liquidity, and quality requirements.
• JPMorgan GBI-EM Global Diversified tracks the performance of local currency debt issued by emerging market governments, whose debt is accessible by most of the international investor base.
• ICE BofA US 3M Tbill Index is an unmanaged index that is comprised of a single U.S. Treasury issue with approximately three months to final maturity, purchased at the beginning of each month and held for one full month.
• Bloomberg US Treasury Bellwether Indices are a series of benchmarks tracking the performance and attributes of eight on-the-run US Treasuries that reflect the most recently issued 3m, 6m, 2y, 3y, 5y, 10y and 30y securities.
Equity
• The S&P 500 Index is a capitalization-weighted index designed to measure performance of the broad domestic economy through changes in the aggregate market value of 500 stocks representing all major industries.
• Russell 3000 Index is a market-cap-weighted index which consists of roughly 3,000 of the largest companies in the U.S. as determined by market capitalization. It represents nearly 98% of the investable U.S. equity market.
• Russell 1000 Index consists of the largest 1000 companies in the Russell 3000 Index.
• Russell 1000 Growth Index measures the performance of those Russell 1000 companies with higher P/B ratios and higher forecasted growth values.
• Russell 1000 Value Index measures the performance of those Russell 1000 companies with lower P/B ratios and lower forecasted growth values.
• Russell Mid Cap Index measures the performance of the 800 smallest companies in the Russell 1000 Index.
• Russell Mid Cap Growth Index measures the performance of those Russell Mid Cap companies with higher P/B ratios and higher forecasted growth values.
• Russell Mid Cap Value Index measures the performance of those Russell Mid Cap companies with lower P/B ratios and lower forecasted growth values.
• Russell 2000 consists of the 2,000 smallest U.S. companies in the Russell 3000 index.
• Russell 2000 Growth Index measures the performance of the Russell 2000 companies with higher P/B ratios and higher forecasted growth values.
• Russell 2000 Value Index measures the performance of those Russell 2000 companies with lower P/B ratios and lower forecasted growth values.
• MSCI USA Barra Earnings Yield Index is a long/short (130/30) index that targets high exposure to the earnings yield factor, low exposure to other style and industry factors, and low tracking error relative to the MSCI USA Index, its parent index. The earnings yield factor combines current and historical earnings-to-price ratios with a measure of analyst- predicted earnings-to price ratios.
• MSCI USA Barra Low Leverage Index The index is derived from the parent index, MSCI Investable Market, and seeks to target exposure to low leverage companies as defined by the Barra Equity Model. The index is rebalanced monthly subject to tracking error and turnover constraints.
• MSCI USA Barra Low Volatility Index aims to reflect the performance characteristics of a minimum variance strategy applied to the large and mid cap USA equity universe. The index is calculated by optimizing the MSCI USA Index, its parent index, in USD for the lowest absolute risk (within a given set of constraints). Historically, the index has shown lower beta and volatility characteristics relative to the MSCI USA Index.
• MSCI USA Barra Momentum Index is derived from the parent index, MSCI Investable Market, and seeks to target exposure to companies with positive price momentum as defined by the Barra Equity Model. The index is rebalanced monthly subject to tracking error and turnover constraints.
• MSCI USA Barra Value Index is derived from the parent index, MSCI Investable Market, and seeks to target exposure to companies with value characteristics as defined by the Barra Equity Model. The index is rebalanced monthly subject to tracking error and turnover constraints.
• MSCI ACWI (All Country World Index) ex. U.S. Index captures large and mid-cap representation across Developed Markets countries (excluding the United States) and Emerging Markets countries. The index covers approximately 85% of the global equity opportunity set outside the U.S.
• MSCI EAFE Index is an equity index which captures large and mid-cap representation across Developed Markets countries around the world, excluding the U.S. and Canada. The index covers approximately 85% of the free float- adjusted market capitalization in each country.
• MSCI Emerging Markets Index captures large and mid-cap representation across Emerging Markets countries. The index covers approximately 85% of the free-float adjusted market capitalization in each country.
Disclosures – Index & Benchmark Definitions
• MSCI EAFE Large Value Index captures large cap securities exhibiting overall value style characteristics across Developed Markets countries around the world, excluding the US and Canada. The value investment style characteristics for index construction are defined using three variables: book value to price, 12-month forward earnings to price and dividend yield.
• MSCI EAFE Large Cap Index is an equity index which captures large cap representation across Developed Markets countries around the world, excluding the US and Canada. The index covers approximately 70% of the free-float adjusted market capitalization in each country.
• MSCI EAFE Large Growth Index captures large cap securities exhibiting overall growth style characteristics across Developed Markets countries around the world, excluding the US and Canada. The growth investment style characteristics for index construction are defined using five variables: long-term forward EPS growth rate, short-term forward EPS growth rate, current internal growth rate and long-term historical EPS growth trend and long-term historical sales per share growth trend.
• MSCI EAFE Mid Value Index captures mid cap securities exhibiting overall value style characteristics across Developed Markets countries around the world, excluding the US and Canada. The value investment style characteristics for index construction are defined using three variables: book value to price, 12-month forward earnings to price and dividend yield.
• MSCI EAFE Mid Cap Index is an equity index which captures mid cap representation across Developed Markets countries around the world, excluding the US and Canada. The index covers approximately 15% of the free-float adjusted market capitalization in each country.
• MSCI EAFE Mid Cap Growth Index captures mid cap securities exhibiting overall growth style characteristics across Developed Markets countries around the world, excluding the US and Canada. The growth investment style characteristics for index construction are defined using five variables: long-term forward EPS growth rate, short-term forward EPS growth rate, current internal growth rate and long-term historical EPS growth trend and long-term historical sales per share growth trend.
• MSCI EAFE Small Cap Value Index captures small cap securities exhibiting overall value style characteristics across Developed Markets countries around the world, excluding the US and Canada. The value investment style characteristics for index construction are defined using three variables: book value to price, 12-month forward earnings to price and dividend yield.
• MSCI EAFE Small Cap Index is an equity index which captures small cap representation across Developed Markets countries around the world, excluding the US and Canada. The index covers approximately 14% of the free float adjusted market in each country.
• MSCI EAFE Small Cap Growth Index captures small cap securities exhibiting overall growth style characteristics across Developed Markets countries around the world, excluding the US and Canada. The growth investment style characteristics for index construction are defined using five variables: long-term forward EPS growth rate, short-term forward EPS growth rate, current internal growth rate and long-term historical EPS growth trend and long-term historical sales per share growth trend.
• MSCI ACWI (All Country World Index) ex USA Large Value Index captures large-cap securities exhibiting overall value style characteristics across Developed Markets countries (excluding the US) and Emerging Markets (EM) countries. The value investment style characteristics for index construction are defined using three variables: book value to price, 12-month forward earnings to price and dividend yield.
• MSCI ACWI (All Country World Index) ex USA Large Index captures large cap representation across Developed Markets countries (excluding the US) and Emerging Markets countries. The index covers approximately 70% of the free float- adjusted market capitalization in each country.
• MSCI ACWI (All Country World Index) ex USA Large Growth Index captures large-cap securities exhibiting overall growth style characteristics across Developed Markets countries (excluding the US) and Emerging Markets countries. The growth investment style characteristics for index construction are defined using five variables: long-term forward EPS growth rate, short-term forward EPS growth rate, current internal growth rate and long-term historical EPS growth trend and long-term historical sales per share growth trend.
• MSCI ACWI (All Country World Index ex USA Mid Value Index captures mid cap securities exhibiting overall value style characteristics across Developed Markets countries (excluding the US) and Emerging Markets (EM) countries. The value investment style characteristics for index construction are defined using three variables: book value to price, 12-month forward earnings to price and dividend yield.
• MSCI ACWI (All Country World Index) ex USA Mid Cap Index captures mid cap representation across Developed Markets countries (excluding the US) and Emerging Markets (EM) countries. The index covers approximately 15% of the free float- adjusted market capitalization in each country.
• MSCI ACWI (All Country World Index) ex USA Mid Growth Index captures mid-cap securities exhibiting overall growth style characteristics across Developed Markets countries (excluding the US) and Emerging Markets countries. The growth investment style characteristics for index construction are defined using five variables: long-term forward EPS growth rate, short-term forward EPS growth rate, current internal growth rate and long-term historical EPS growth trend and long-term historical sales per share growth trend.
• MSCI ACWI (All Country World Index) ex USA Small Value Index captures small cap securities exhibiting overall value style characteristics across Developed Markets countries (excluding the US) and Emerging Markets (EM) countries. The value investment style characteristics for index construction are defined using three variables: book value to price, 12-month forward earnings to price and dividend yield.
• MSCI ACWI (All Country World Index) ex. U.S. Small Cap Index captures small cap representation across Developed Markets countries (excluding the US) and Emerging Markets countries. The index covers approximately 14% of the global equity opportunity set outside the U.S.
• MSCI ACWI (All Country World Index) ex U.S. Small Growth Index captures mid-cap securities exhibiting overall growth style characteristics across Developed Markets countries (excluding the US) and Emerging Markets countries. The growth investment style characteristics for index construction are defined using five variables: long-term forward EPS growth rate, short-term forward EPS growth rate, current internal growth rate and long-term historical EPS growth trend and long-term historical sales per share growth trend.
• MSCI Emerging Markets (EM) Large Value Index captures large-cap securities exhibiting overall value style characteristics across Emerging Markets (EM) countries. The value investment style characteristics for index construction are defined using three variables: book value to price, 12-month forward earnings to price and dividend yield.
• MSCI Emerging Markets (EM) Large Index includes large-cap representation across Emerging Markets countries. The index covers approximately 70% of the free float-adjusted market capitalization in each country.
• MSCI Emerging Markets (EM) Large Growth Index captures large-cap securities exhibiting overall growth style characteristics across Emerging Markets (EM) countries. The growth investment style characteristics for index construction are defined using five variables: long-term forward EPS growth rate, short-term forward EPS growth rate, current internal growth rate and long-term historical EPS growth trend and long-term historical sales per share growth trend.
• MSCI Emerging Markets (EM) Mid Value Index captures mid cap securities exhibiting overall value style characteristics across Emerging Markets (EM) countries. The value investment style characteristics for index construction are defined using three variables: book value to price, 12-month forward earnings to price and dividend yield.
• MSCI Emerging Markets (EM) Mid Index includes mid-cap representation across Emerging Markets countries. The index covers approximately 15% of the free float-adjusted market capitalization in each country.
Disclosures – Index & Benchmark Definitions
• MSCI Emerging Markets (EM) Mid Growth Index captures mid cap securities exhibiting overall growth style characteristics across Emerging Markets (EM) countries. The growth investment style characteristics for index construction are defined using five variables: long-term forward EPS growth rate, short-term forward EPS growth rate, current internal growth rate and long-term historical EPS growth trend and long-term historical sales per share growth trend.
• MSCI Emerging Markets (EM) Small Value Index captures small cap securities exhibiting overall value style characteristics across Emerging Markets (EM) countries. The value investment style characteristics for index construction are defined using three variables: book value to price, 12-month forward earnings to price and dividend yield.
• MSCI Emerging Markets (EM) Small Cap Index includes small cap representation across Emerging Markets countries. The index covers approximately 14% of the free float-adjusted market capitalization in each country. The small cap segment tends to capture more local economic and sector characteristics relative to larger Emerging Markets capitalization segments. MSCI Emerging Markets (EM) Small Growth Index captures small cap securities exhibiting overall growth style characteristics across Emerging Markets (EM) countries. The growth investment style characteristics for index construction are defined using five variables: long-term forward EPS growth rate, short-term forward EPS growth rate, current internal growth rate and long-term historical EPS growth trend and long-term historical sales per share growth trend.
Alternatives & Miscellaneous
• S&P Real Asset Index is designed to measure global property, infrastructure, commodities, and inflation-linked bonds using liquid and investable component indices that track public equities, fixed income, and futures. In the index, equity holds 50% weight, commodities 10%, and fixed income 40%.
• FTSE Nareit Equity REITs Index contains all Equity REITs not designed as Timber REITs or Infrastructure REITs.
• FTSE EPRA Nareit Developed Index is designed to track the performance of listed real estate companies and REITS worldwide.
• FTSE EPRA Nareit Developed ex US Index is a subset of the FTSE EPRA Nareit Developed Index and is designed to track the performance of listed real estate companies and REITS in developed markets excluding the US.
• Bloomberg Commodity Index is calculated on an excess return basis and reflects commodity futures price movements. The index rebalances annually weighted 2/3 by trading volume and 1/3 by world production and weight-caps are applied at the commodity, sector and group level for diversification.
• HFRI Fund Weighted Composite Index is a global, equal-weighted index of over 2,000 single-manager funds that report to the HFR Database. Constituent funds report monthly net of all fees performance in U.S. Dollars and have a minimum of $50 million under management or a twelve (12) month track record of active performance. The HFRI Fund Weighted Composite Index does not include Funds of Hedge Funds.
• HFRI Fund of Funds Composite Index is a global, equal-weighted index of all fund of hedge funds that report to the HFR Database. Constituent funds report monthly net of all fees performance in U.S. Dollars and have a minimum of $50 million under management or a twelve (12) month track record of active performance.
• The Alerian MLP Index is a float adjusted, capitalization-weighted index, whose constituents represent approximately 85% of total float-adjusted market capitalization, is disseminated real-time on a price-return basis (AMZ) and on a total- return basis.
Additional Information
• Equity sector returns are calculated by S&P, Russell, and MSCI for domestic and international markets, respectively. S&P and MSCI sector definitions correspond to the GICS® classification (Global Industry Classification System); Russell uses its own sector and industry classifications.
• MSCI country indices are free float-adjusted market capitalization indices that are designed to measure equity market performance of approximately 85% of the market capitalization in each specific country.
• Currency returns are calculated using FactSet’s historical spot rates and are calculated using the U.S. dollar as the base currency.
Disclosures – Material Risks & Limitations
Fixed Income securities are subject to interest rate risks, the risk of default and liquidity risk. U.S. investors exposed to non-U.S. fixed income may also be subject to currency risk and fluctuations.
Cash may be subject to the loss of principal and over longer period of time may lose purchasing power due to inflation.
Domestic Equity can be volatile. The rise or fall in prices take place for a number of reasons including, but not limited to changes to underlying company conditions, sector or industry factors, or other macro events. These may happen quickly and unpredictably.
International Equity can be volatile. The rise or fall in prices take place for a number of reasons including, but not limited to changes to underlying company conditions, sector or industry impacts, or other macro events. These may happen quickly and unpredictably. International equity allocations may also be impact by currency and/or country specific risks which may result in lower liquidity in some markets.
Real Assets can be volatile and may include asset segments that may have greater volatility than investment in traditional equity securities. Such volatility could be influenced by a myriad of factors including, but not limited to overall market volatility, changes in interest rates, political and regulatory developments, or other exogenous events like weather or natural disaster.
Private Equity involves higher risk and is suitable only for sophisticated investors. Along with traditional equity market risks, private equity investments are also subject to higher fees, lower liquidity and the potential for leverage that may amplify volatility and/or the potential loss of capital.
Private Credit involves higher risk and is suitable only for sophisticated investors. These assets are subject to interest rate risks, the risk of default and limited liquidity. U.S. investors exposed to non-U.S. private credit may also be subject to currency risk and fluctuations.
Private Real Estate involves higher risk and is suitable only for sophisticated investors. Real estate assets can be volatile and may include unique risks to the asset class like leverage and/or industry, sector or geographical concentration. Declines in real estate value may take place for a number of reasons including, but are not limited to economic conditions, change in condition of the underlying property or defaults by the borrow.
Marketable Alternatives involves higher risk and is suitable only for sophisticated investors. Along with traditional market risks, marketable alternatives are also subject to higher fees, lower liquidity and the potential for leverage that may amplify volatility or the potential for loss of capital. Additionally, short selling involved certain risks including, but not limited to additional costs, and the potential for unlimited loss on certain short sale positions.